
In academic and professional research there is a simple phrase that is not only acceptable; it also sets the stage for future research. The phrase is “I don’t know.” I could have posted this on one of my other blogs, but it appears this issue most often becomes a problem when religion is being discussed. That is, I most often see “I don’t know” mocked by people who claim to have answers that they can’t actually know to be true. Researchers, on the other hand, wholeheartedly accept “I don’t know” as a valid answer, and they begin collecting data to attempt to change their lack of knowledge.
In research there’s another common phrase: “Correlation is not causation.” Let’s take a look at some of my research from a few years ago (statisticians will have their interests piqued the most). This is a simple multivariate regression I did in Excel (I usually use SPSS, but not this time). This post is my most science-y post yet. Please bear with the research, or skip to Part 2 for the crux of my argument.
Part 1: Statistical Analysis of Corruption Perceptions (2012)
I’m showing some of my research from 2012 because the findings are pretty good. There’s a very strong correlation. But this correlation doesn’t imply that “I know” the results are perfect.
Research question: What causes corruption perceptions?
The variables I used were:
Independent: Female participation in government, polity as measured on a twenty point running scale (‐10 to +10, with ‐10 being most authoritarian and +10 being most democratic), economic equality (Gini) on a scale of one to 100 (with one being perfect equality and 100 being perfect inequality), gross domestic product per capita as measured in thousands of dollars (KGDPc), and a categorical variable for stability (stable); that is, whether or not a regime type has lasted for a decade or more.
Dependent: Corruption Perception Index (CPI) (2012), data provided by Transparency International. In other words, how corrupt the states’ civilians perceive their governments to be.
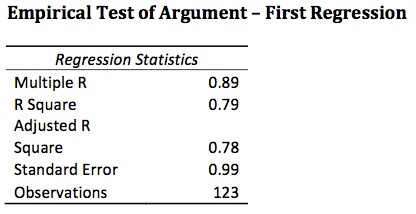
I found a very strong correlation (see chart above) between CPI and FemPar, polity, Gini, KGDPc and stable, with an adjusted R‐square of 0.78. In other words, these variables accounted for 78 percent of corruption perceptions. Breaking down the regression by individual variables, we can see some important results. Two things to consider are the coefficients and the P‐values.
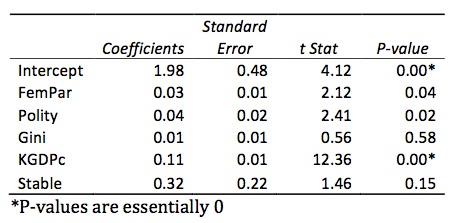
First, FemPar is statistically significant because its P‐value is below 0.05 at 0.04. Its coefficient is 0.03. That is, for every percentage point increase in female participation in government, CPI rises by 0.03. It should also be noted that a government made up of only women has a CPI score increased by 2.47. Polity is also statistically significant. For every point increase in polity, we see a 0.04 increase in CPI. KGDPc is the most telling. With a P‐ value that is essentially zero, we see a rise of 0.11 in CPI for every increase in GDP per capita of one thousand dollars. Gini and stable are weakly correlated with P‐values above 0.05, but the correlation suggests that for every increase in Gini of one point, we see an increase in CPI score of 0.01, which is counter intuitive because a Gini score of 100 is perfect inequality (that is, one person owns all the wealth). Stable suggests that regimes that have survived for over a decade have 0.32 higher CPI scores than less‐stable regimes. Because of the low correlation, there is little need to determine if length of regime as a continuous variable is explanatory.
[[EDIT: It’s been brought to my attention that I forgot to include the STDEVs. Please forgive my oversight. I was more concerned with the argument of my post than I was the argument of my original research. In any case, here are the STDEVs and a short discussion:

Because FemPar increases CPI score by 0.03 for each percentage point of FemBar, and because the STDEV is 9.17, a rise in one STDEV in FemBar will result in a rise of 0.28 in CPI. A rise in one STDEV of polity results in an increased CPI score of 0.22. A rise of one STDEV of Gini sees CPI rise by 0.1. And a rise of KGDPc by one STDEV has a CPI score rise of 4.68. It must be noted again that Gini is weakly correlated.
I’m under the impression most of you aren’t interested in the rest of my research, which then went into a 3,000 word analysis of the potential reasons for my findings. I will not post it here for the sake of saving space.]]
Part 2: Why “I don’t know” works
The Adjusted R-square above is pretty damned good. It’s by no means perfect, but I would feel comfortable submitting my findings to a Senate inquiry and standing by my argument of how to deal with corruption perceptions. I would stop way short, however, of telling the Senate body that I know, for example, female participation in government would help solve their problems. Why? Because I don’t know that. My regression shows a correlation, but it fails to explain why there is a correlation. Furthermore, correlation is not causation.
Perhaps even more significant are the variables with higher than desired P-values. Notice again in the first chart. I only collected data on 123 countries. Depending on your definition of a country (state, actually), I’m missing data for about 75 states. If the Senate body asked me how certain I was that Gini affects corruption perceptions, I would say “I’m neither certain nor uncertain. Future research must be conducted before I can give a better answer.”
If I were to claim that I possess knowledge that Gini plays no role in our perceptions of state corruption, I would not only be being dishonest, the Senate might use my professional opinion as an excuse to disregard Gini when dealing with corruption perceptions. It could be (but it’s unlikely) that Gini plays a massive role in our perceptions of state corruption. Therefore, it’s not only dishonest; it’s counterproductive.
On a personal note, when I defended my thesis my board asked me if there could be other variables I don’t know about yet (I was presenting on what causes self-immolation). I answered, “Unfortunately, more people have to commit suicide in order to determine that.” It might sound like a heartless answer (and it is), but it’s the only answer we can get because we can’t get into the heads of suicide victims.
Part 3: What does this mean in the religious context?
When people profess to have direct knowledge that a) god exists or b) their religious teachings are the answer to social or other phenomena, it’s possible they are a psychopath. Exhibit 1, ladies and gentlemen of the jury:

If they aren’t a psychopath, then the other option is that they don’t quite grasp the importance of the phrase “I don’t know.” They don’t understand (or they reject) that “I know” is both intellectually dishonest, even if the correlation is strong, and counterproductive and possibly dangerous. Unfortunately I see this all the time.
It’s not just psychopaths proclaiming to be Jesus, holding a sign about the end times on the corner of Granby St; it’s also well-intentioned old ladies who claim things like “I know Jesus will get you through this.” … I know your problems can be answered by putting faith in Jesus … instead of determining what the actual cause of the problem is and working to resolve it yourself. It’s actually better to say “I don’t know what the cause of my problem is, but I will work to figure it out” than it is to say “I’m not putting enough faith in Jesus. If I put a little more faith in him, then he will take the burden from me.” To do the latter is to completely ignore the problem. Or even worse, it’s risking never finding out the actual source of your problem by putting all your efforts into increasing your faith in your god because you “know” that’s the answer.
Conclusion
Saying “I don’t know” is useful in any context. It’s honest about your knowledge about the causes of certain phenomena. It allows for and encourages future research and discoveries. And it acknowledges that you’re not 100% knowledgable about the existence of god. Let’s face it: Besides the aforementioned psychopaths, everyone is an agnostic because they don’t pretend to know whether or not god 100% does or does not exist.
This post utilizes statistical analysis to illustrate its point, but when dealing with knowledge, no matter what method you’re using to collect it, “I don’t know” is infinitely more valuable than saying “I know” when in fact you don’t.

I’ve been running into these problems a lot lately with Christian comments on my blog. “I don’t know” is perfectly fine, and yet I sometimes get a “CHECKMATE, ATHEIST!” when I say that. Correlation getting equated with causation is, I think but I am not 100% sure, almost always the reasoning used after the gotcha moment.
Your post is great, and I wholeheartedly concur that “I don’t know” is acceptable. From my educational background, the difference between being honest and dishonest can result in problems with litigation, and maybe even ethical sanctions.
Just out of curiosity, are you a lawyer?
Yes I am.
Ah. That’s cool. I thought about going to law school once upon a time. I took my LSAT but did much better on the standard GRE, so I went for grad school instead. I kind of regret not doing it though, because a friend of mine is in the space law field, which is a tiny, tiny field, but with a lot of potential. I’m a child at heart and want to be a space lawyer.
My license is in Florida, but it’s tough to do stuff like that. If I could, though, yeah, space law would be awesome.
Especially if eventually I could do it in space.
In my biotechnology class we use statistical analysis to measure the accuracy and usefulness of our protein assays.
Out R square value must be over 0.98.
Yours is a paltry 0.79 demonstrating that your data points are all over Sam Hill.
Missing from your table is the very important standard deviation which shows the relationship between your data points.
I sincerely doubt whether there is any relationship at all between your data points, which means your “statistical analysis” is bogus.
Why not just use common sense?
If we are making an argument and we admit, “I don’t know,” what I’m talking about then we need to quit wasting everyone’s time.
On the other hand, if we understand our arguments and therefore know what we are talking about, than why not have a discussion?
The point is not my data. Of course I could have added 20 variables and gotten a very good adjusted R sq, but that’s not very impressive. The point is for parsimony. I’m at work now, but when I get home I will post my stdevs if you’re actually interested. Or I can send you my full report.
I’ve updated the post to reflect the STDEVs of the independent variables, along with a short discussion about them.
As per your original comment, I agree that a high Adjusted R-Sq is optimal in the hard sciences. Biology is indeed a hard science, if only loosely. In the social sciences, however, we are less concerned with AR-sqs in the high 90s as we are with using as few variables as possible to achieve a parsimonious explanation. If I included every variable at my disposal, my adjusted R-sq would’ve been essentially 100, but I would’ve lost all explanatory power. In my field 0.78 is very, very good for five IVs.